
This NEW AI Feature Turns Ideas into Diagrams in Seconds: Jenni AI

A strong research paper does not only explain ideas in paragraphs. It also shows how those ideas connect. A workflow, conceptual framework, theoretical model, methodology, comparison table, or PRISMA diagram can make a complex argument much easier to understand. The problem is that researchers often have to leave their writing tool, open a separate drawing or mind-mapping application, build the visual manually, export it, and then return to the document.
That entire process can now be much faster with Jenni AI's new Visualize Concepts feature. Instead of switching between several tools, you can ask Jenni AI to turn your research ideas, uploaded content, or selected sections into diagrams while you continue working inside the same research environment.
In this article, we will explain how the feature works, what types of research visuals it can create, how to write better prompts, and how to edit the generated diagrams before using them in your final document.
Access Jenni AI and claim your discount
You can access Jenni AI from this link: Access Jenni AI
Use the discount code RIZ20 when you upgrade to a paid plan. You can also try the tool for free with limited credits through the same link before deciding whether its research features fit your workflow.
What is Jenni AI's Visualize Concepts feature?
Jenni AI's Visualize Concepts feature is designed to convert written information into a visual structure. You can describe what you want in AI Chat, provide content from your research document, or ask Jenni to identify and organize the relationships between different concepts.
The feature is especially useful because it is built into the same AI Chat panel that researchers already use for drafting, improving paragraphs, finding sources, and working with citations. You do not have to copy your content into a separate diagram generator every time you need a visual explanation.

For example, you can ask Jenni AI to:
Create a workflow for your research methodology.
Build a conceptual or theoretical framework.
Visualize the structure of a systematic literature review.
Compare two theories, models, or research approaches.
Create a PRISMA-style literature review diagram.
Show inclusion and exclusion criteria.
Convert the main ideas of an uploaded document into a mind map.
Present the relationships between variables, dimensions, and applications.
The important point is that the feature does not simply decorate your document. It helps you organize the logic behind your research and then express that logic in a visual form.
Why this matters for researchers
Many research ideas are difficult to communicate through text alone. A paragraph may explain that one variable affects another, but a diagram can show the direction of that relationship immediately. A methodology section may describe several stages, but a flowchart can make the order and movement between those stages obvious.
This is useful for several reasons:
Better understanding: A visual structure helps you see whether your ideas are connected logically or whether important steps are missing.
Clearer communication: Supervisors, reviewers, and readers can understand a well-organized framework more quickly than a long block of explanation.
Professional presentation: A clean diagram can make a proposal, thesis, dissertation, or literature review look more complete and easier to navigate.
Faster editing: When you see all parts of an argument together, it becomes easier to remove repetition, combine overlapping concepts, and identify gaps.
Less tool switching: Because the visual is generated inside Jenni AI, you can move from writing to visualization without rebuilding your work in another application.
How to use the feature step by step
1. Open AI Chat inside your Jenni AI document
Start by opening the research document you are working on and going to the AI Chat feature. This is the same panel used for writing assistance, source-related questions, and document improvement.
The advantage of starting here is that you can work with the context of your document. You can either write a new instruction, paste the relevant section, or ask Jenni AI to use information from the document you have already uploaded.

2. Clearly describe the visual you need
Your prompt should explain what you want to visualize, what information must be included, and how the diagram should be organized. A vague instruction such as “make a diagram” may produce a visual that is too broad or overcrowded.
A stronger prompt would be:
Create a clean conceptual framework showing how social media usage affects academic performance through student engagement. Separate the independent variable, mediating variable, and dependent variable. Use a simple academic layout with directional arrows and minimal text.
This prompt is better because it identifies the type of visual, the variables, the relationships, and the preferred style.
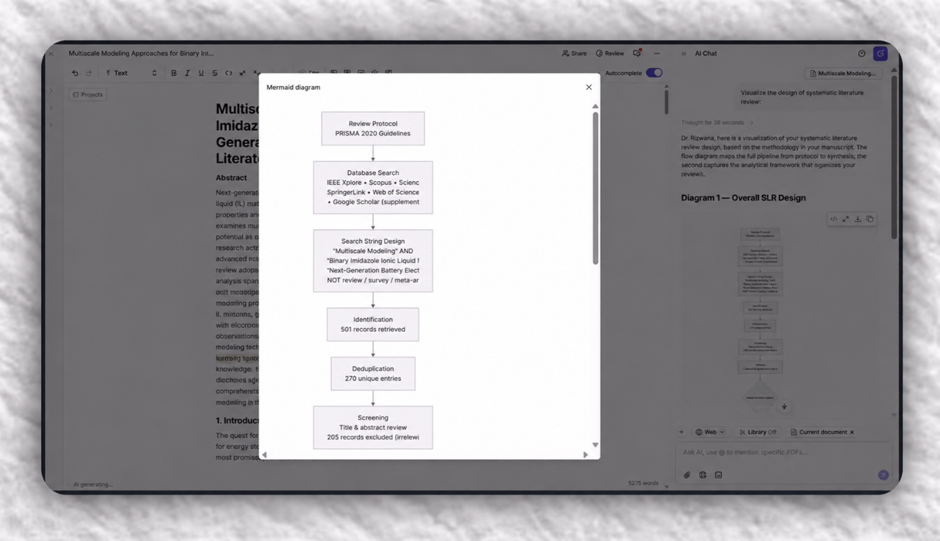
3. Review the generated design options
Jenni AI can provide different variations of the visual. Review each version instead of accepting the first result automatically. One design may be better for a proposal, while another may be more suitable for a presentation or a literature review chapter.
Look for the following qualities:
Are all important concepts included?
Are the relationships shown in the correct direction?
Are the labels accurate and readable?
Is the diagram too crowded?
Does the structure match the explanation in your research document?
Can a reader understand the visual without needing a long explanation?
The tool can generate a starting point quickly, but your academic knowledge is still necessary to judge whether the structure is correct.
4. Explore the diagram code when changes are needed
One of the useful parts of the feature is that the diagram can be supported by generated code. If the visual is almost correct but needs a small adjustment, you can open the code section and modify the relevant labels, connections, or structure.
For example, you may need to:
Rename a variable.
Add or remove a stage in a workflow.
Change the direction of an arrow.
Correct the order of methodology steps.
Remove unnecessary text.
Add another dimension to a framework.
After making the changes, return to the diagram view to check the result. This gives you more control than a fixed image because you can refine the structure instead of starting again from the beginning.

5. Expand, copy, or download the final diagram
Once the visual is ready, you can expand it for a closer review. You can also copy it or download it as an image and insert it into your Word document, proposal, thesis, presentation, or literature review.
Before downloading, check the image at full size. Small labels that look clear in the interface may become difficult to read when inserted into a document. If necessary, simplify the diagram or generate a larger, less crowded version.
Use case 1: Create a conceptual or theoretical framework
A conceptual framework is one of the most common visuals required in academic research. Supervisors often expect to see how the independent variables, dependent variables, mediating variables, moderating variables, and research outcomes relate to one another.
You can ask Jenni AI to create this structure after identifying the variables in your study. For example:
Identify the independent, dependent, and mediating variables in this research description. Then create a minimal conceptual framework showing the proposed relationships between them.
The order is important. First identify and verify the variables. Then ask the tool to draw the framework. If you ask for a diagram before clarifying your research model, Jenni AI may produce an overcrowded or overexplained visual that does not match your actual study.
For research that is not based on conventional independent and dependent variables, you should explain the study parameters clearly. A scientific study may be organized around dimensions, stages, materials, processes, or applications rather than a simple variable-based model. Giving Jenni AI this context will help it create a more relevant framework.
Use case 2: Visualize a systematic literature review
A systematic literature review often includes several connected elements, such as the research question, search strategy, databases, screening process, eligibility criteria, included studies, themes, and final synthesis.
Instead of describing this structure only in text, you can ask Jenni AI to create a visual overview of the review. You can also provide the relevant section of your literature review and ask the tool to organize it into a diagram.
For example:
Create a clear visual structure for this systematic literature review. Group the studies according to their main themes, show the review stages in sequence, and keep the design suitable for an academic document.
The generated diagram can help you see whether your review has a coherent structure. It may also reveal that two themes overlap or that an important stage has not been explained in enough detail.
Use case 3: Create a PRISMA-style diagram
A PRISMA diagram is useful for showing how records move through the stages of a systematic review. These stages commonly include identification, screening, eligibility, and inclusion.
You can ask Jenni AI to create a clean PRISMA-style visual and then provide the relevant numbers and reasons for exclusion. For example:
Create a clean PRISMA-style diagram for this literature review. Include identification, screening, eligibility, and inclusion stages. Show the number of records at each stage and state the main reasons for exclusion.
The tool can also help you visualize inclusion and exclusion criteria separately. You can paste the criteria into AI Chat and ask for a two-part diagram that clearly distinguishes which studies qualify and which studies do not.
Always verify the counts and wording yourself. A diagram can look professional while still containing an incorrect number or an inaccurate category.
Use case 4: Compare two theories, models, or methodologies
Researchers often have to decide between two theories, models, or research approaches. A written comparison is useful, but a visual comparison can make the differences much easier to identify.
You can ask Jenni AI to compare the two options across specific parameters, such as:
Main purpose.
Assumptions.
Research context.
Data requirements.
Strengths.
Limitations.
Suitable applications.
Expected outcomes.
A useful prompt might be:
Compare Theory A and Theory B across purpose, assumptions, methodology, strengths, limitations, and suitable research applications. Present the differences in a clear visual comparison model and include a short conclusion about when each theory is more appropriate.
This approach can help you move beyond a surface-level comparison. It encourages you to define the criteria before choosing an approach, which makes the decision easier to justify in your research proposal.
Use case 5: Organize dimensions, materials, and applications
Some studies are structured around several dimensions rather than variables. For example, a research topic may include ionic liquids and ion transport, battery electrolytes, advanced materials, and practical applications.
In this situation, you can ask Jenni AI to divide the topic into major dimensions and connect each dimension to its related concepts. You can then review the generated code and adjust the categories according to your literature review.
This type of visual is useful for showing the scope of a research field. It can also help you identify whether your study is trying to cover too many areas at once.
How to write better prompts for accurate diagrams
The quality of the diagram depends heavily on the clarity of your instructions. Include these five details whenever possible:
Name the type of visual. Say whether you need a flowchart, mind map, conceptual framework, theoretical framework, comparison model, PRISMA diagram, or process diagram.
Define the content. List the concepts, variables, stages, theories, or criteria that must appear.
Explain the relationships. State which elements influence, lead to, depend on, or are compared with one another.
Specify the audience. Mention whether the visual is for a thesis chapter, research proposal, journal article, class presentation, or general explanation.
Set design limits. Ask for a minimal, clean, academic, readable, or detailed layout depending on your needs.
For example, instead of writing “make a framework about my research,” write:
Create a minimal academic conceptual framework for a research proposal. Place digital literacy as the independent variable, learning engagement as the mediating variable, and academic performance as the dependent variable. Use directional arrows, short labels, and no unnecessary decorative elements.
That level of instruction gives Jenni AI a much clearer structure to follow.
Do not use the first diagram without checking it
AI-generated visuals are useful, but they are not automatically correct. The diagram represents your research argument, so you are responsible for checking every part of it.
Before using the image in a final document, verify:
The names of all theories, variables, and concepts.
The direction of every arrow.
The order of each research stage.
The numbers in a PRISMA diagram.
The relationship between the diagram and your written explanation.
The spelling and formatting of labels.
Whether the visual is consistent with your research design.
You should also avoid adding relationships simply because they look visually attractive. A diagram must reflect your methodology and evidence, not create unsupported claims.
Jenni AI includes more than visualization
The visualization feature is part of a wider research workflow in Jenni AI. You can use the platform to develop research ideas, build an outline, improve individual sections, and ask questions about your uploaded material.
Its review-related features can also help you examine the quality of a document before submission. Depending on your workflow, you can use Jenni AI to:
Improve the structure and flow of a research paper.
Proofread grammar and clarity.
Adjust the tone of a section.
Review a document from an academic perspective.
Check citation-related information and source quality.
Examine claim confidence and identify areas that need stronger support.
Cross-check references and replace citations when necessary.
These features are most useful when they support your own research judgment. AI can help you find weaknesses and organize information, but you should still read the original sources, verify claims, and follow the ethical requirements of your institution or journal.
Final thoughts
Jenni AI's Visualize Concepts feature closes an important gap in academic writing. Researchers no longer have to treat writing, diagram creation, and document organization as completely separate tasks. You can draft an idea, ask questions about it, identify the important relationships, and turn those relationships into an editable visual without leaving the same workspace.
The feature is especially valuable for conceptual frameworks, systematic literature reviews, PRISMA diagrams, methodology workflows, theory comparisons, and research mind maps. Its biggest advantage is speed, but its real value comes from helping you think more clearly about the structure of your research.
Start with a clear prompt, define the concepts and relationships, review the available design variations, and edit the generated code when necessary. Most importantly, treat the result as a working visual that requires academic checking, not as a final answer that can be accepted without review.
For researchers seeking expert guidance throughout their academic journey, Scientific Pakistan provides professional support for refining research and strengthening its alignment with international academic standards.
Try Jenni AI for your next research project
If you want to create research diagrams without moving between several tools, try Jenni AI from the access link. Use discount code RIZ20 to claim the available offer, and begin with a free trial if you want to explore the visualization feature before upgrading.
A few minutes of structured prompting can turn a confusing research idea into a visual model that is easier to understand, explain, and improve.


Comments